Movies+
Network visualizations are fun to look at, especially the dynamic animations (“movies”), but they’re also scientifically important. The images can be an effective tool for communicating network concepts to a general audience, for gaining intuition about the influence of a term in a network model on predicted network structure and dynamics, and for diagnosing unexpected findings.
statnet supports the creation of a wide range of network visualizations, static and dynamic, fixed and interactive. We’ve pulled a few of our favorites together here to give you a sense of what’s possible, and to showcase how statnet can be used in pedagogical, scientific and policy applications. Links and citation information are included.
Static networks:
Static network plotting is handled by the network package (written by Carter Butts). Plotting examples are sprinkled throughout our workshops and training materials.
Check out Can’t I please just visit one friend – a lesson in network connectivity for the Covid-19 era.
Dynamic networks:
For network movies, the key package is ndtv (written by Skye Bender-deMoll). There is a workshop and tutorial on that package that you can access from the “Workshops” tab above.
Concurrent Partnerships and HIV Transmission Risk
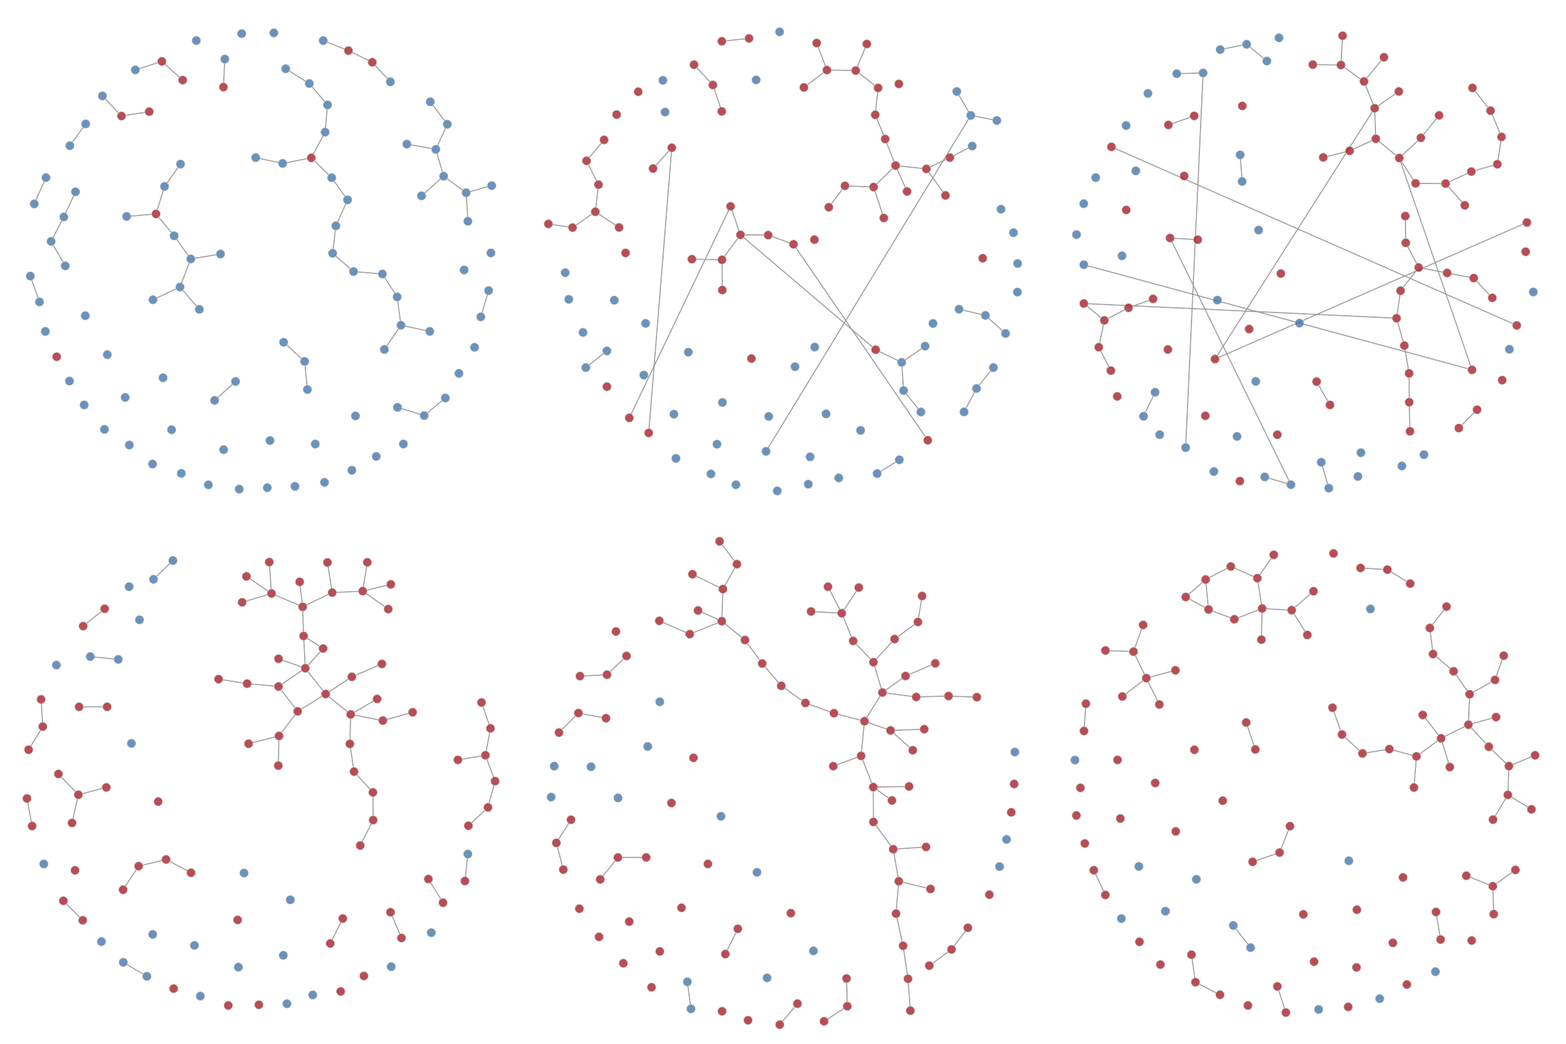
An illustration of the impact of the timing and sequence of dynamic partnerships on the growth of the “forward reachable path” – the network foundation for transmission of infection. The model for the dynamic network is a temporal ERGM estimated from the National Longitudinal Survey of Adolescent Health (2000).
- Citation: Morris, M., A. Kurth, D. T. Hamilton, J. Moody, S. Wakefield and for The Network Modeling Group (2009). “Concurrent partnerships and HIV prevalence disparities by race: Linking science and public health practice.” Amer J Pub Health 99(6): 1023 - 1031. DOI: 10.2105/AJPH.2008.147835.
Network-Based Classification and Modeling of Amyloid Fibrils
An illustration of how network models can be used to characterize and simulate the formation of amyloid fibrils. Includes a demonstration of fibril formation using ERGMs.
-
Citation: Grazioli, Gianmarc; Yu, Yue; Unhelkar, Megha H.; Martin, Rachel W.; and Butts, Carter T. (2019). “Network-based Classification and Modeling of Amyloid Fibrils.” Journal of Physical Chemistry, B, 123(26), 5452-5462. DOI: 10.1021/acs.jpcb.9b03494.
More examples
You can find lots of examples of research-level network animations on Carter Butts’ website.
Add your visualizations!
Have a movie or network graphic you’ve built using Statnet tools that you’d like to showcase? Please email us at contact@statnet.org and we’ll add it here!
